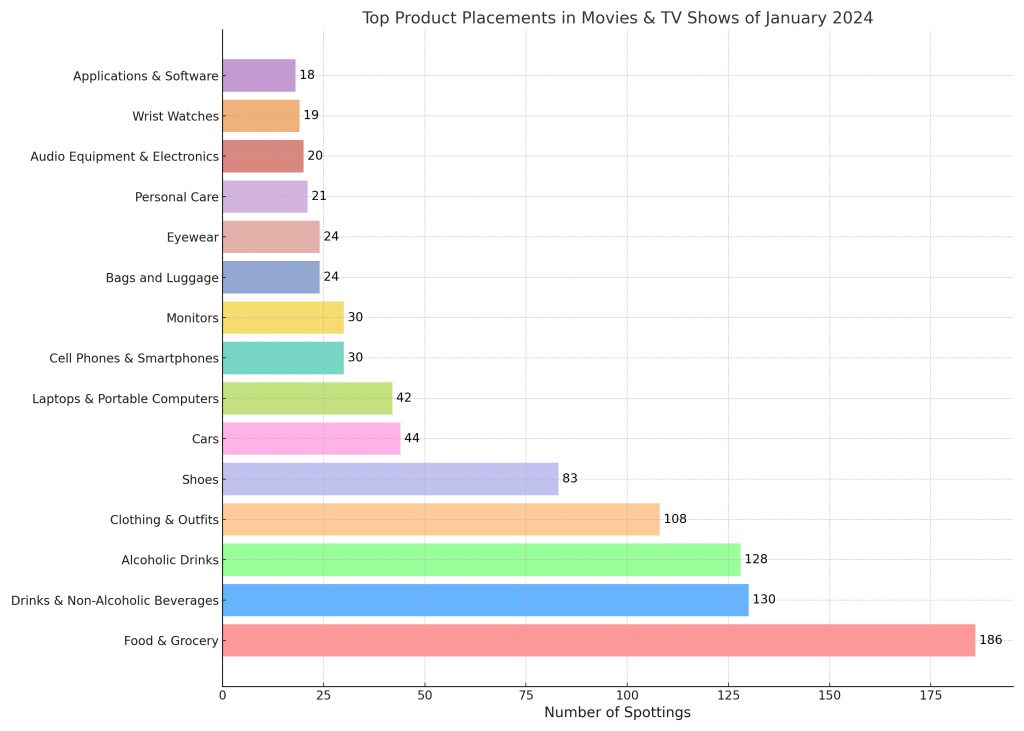
This infographic, compares the number of branded product categories most commonly found when analyzing all U.S. movies and TV series released in January 2024.
- Food & Grocery items lead with 186 spottings.
- Drinks & Non-Alcoholic Beverages are placed 130 times.
- Alcoholic Drinks have 128 spottings.
- Clothing & Outfits are spotted 108 times.
- Shoes are represented with 83 spottings.
- Cars have 44 spottings.
- Laptops & Portable Computers are spotted 42 times.
- Both Cell Phones & Smartphones and Monitors have 30 spottings each.
- Bags and Luggage, along with Eyewear, are each spotted 24 times.
- Personal Care products have 21 spottings.
- Audio Equipment & Electronics are spotted 20 times.
- Wrist Watches have 19 spottings.
- Applications & Software have the least spottings at 18.

